CHAPTER 11
DEEPENING PERSPECTIVE: A NEW LOOK AT THE OLD WORLD
Among the most important contributions rockets, satellites, and space probes made to science was the new perspective they afforded in many areas, particularly in the earth and planetary sciences. Earth scientists, of course, had always enjoyed an advantage in being close to the object of study, living on the earth and immersed in its atmosphere, where the investigator could collect great quantities of data in situ. This was the very advantage that scientists seized upon when sounding rockets made it possible at long last to get on-the-spot measurements in the upper atmosphere. But a certain myopia was also associated with being too close to the object of study.
One of the tasks facing the researcher on the ground was developing an integrated picture of what was often a very large-scale, as well as complex, system. The meteorologist, for example, in spite of the enormous quantities of data he gathered on the weather, still found them too sparse. Even on land they came from rather widely separated stations, and there were none at all from vast stretches of the oceans. As a consequence the investigator was hard pressed to describe with any confidence the huge cyclonic systems and their interrelationship that characterized the general circulations of the earth’s lower atmosphere let alone tell what the weather was like in remote unobserved regions. But when the first weather satellite pictures became available, showing cloud patterns over both continents and oceans, the meteorologist had at hand one of the integrating factors that he needed. For, clouds, being intimately associated with pressure patterns and air circulations, showed by their distributions the major weather systems. Most of what was seen in the early cloud pictures was expected, but there were also surprises. The author can recall hearing Dr. Harry Wexler, director of research for the U.S. Weather Bureau and strong proponent of weather satellites years before any satellite had flown, exclaim that he had never expected the large-scale patterns of atmospheric vortices that stood out in many satellite photographs. When in the course of time satellite cloud imaging was improved in resolution and supplemented by techniques for measuring cloud heights, the vertical distribution of atmospheric temperatures, and local winds, meteorology became not merely local, not merely regional, but the global science it had always aspired-and needed-to be.1
Meteorologists were among the most ready to take advantage of the new approach and in short order used the satellite pictures in making weather forecasts. But such pictures also showed complete ice fields, total watersheds, entire geological provinces such as volcanic fields or geosyncline basins, varying patterns of land use, and vast expanses of ocean. To many it was clear from the start that the perspective afforded by satellite observations would in time prove of immense value in these and other areas. Such has proved true.2
After more than a decade of rocket sounding of the upper atmosphere, space science was quite ready to benefit from the new perspective. In the first half dozen years following the formation of NASA, especially rapid progress was made in the continued study of the upper atmosphere and ionosphere, solar physics, rocket astronomy, geodesy, and the magnetosphere. Accomplishments in the last two areas provide good illustrations of the power of space techniques for scientific research and are the subject of this chapter. The contributions to geodesy were anticipated, causing a number of researchers to give serious attention to the possibilities during the 1950s, years before Sputnik went aloft.3 In contrast, the magnetosphere emerged as something of a surprise from the early rocket and satellite work on particles and fields.
THE MAGNETOSPHERE
For want of a more appealing name the phrase particles and fields came into early use in the space program to denote the study of magnetic and electric fields in space and a variety of particle radiations. Among the last named were the extremely energetic cosmic rays, plasma radiations from the sun, and the electrons, protons, or whatever they were that were thought to cause the auroras. (Gravitational fields were not included, falling rather under geodesy, relativity, and cosmology, with which gravity studies were naturally associated.) The term magnetosphere denotes the region of space surrounding the earth where the earth’s magnetic field plays a prominent, often controlling, role relative to various particle radiations found there. As will be seen, magnetospheric physics constituted an important aspect of the discipline of particles and fields.
The discovery of the magnetosphere began with Van Allen’s discovery of the earth’s radiation belt. At White Sands, New Mexico, Van Allen had traced the curve of cosmic ray intensity through the Pfotzer maximum to a more or less steady value at heights greater than 55 km that looked very much as though it might be the free space value of the cosmic ray intensity.4
Cosmic rays, being charged particles, were affected by the earth’s magnetic field, and fewer of them were able to get in over the geomagnetic equator than in the polar regions. The less energetic rays were the most affected by the magnetic field, making it difficult to determine what the lower end of the cosmic ray spectrum might be in interplanetary or inter stellar space. Since the total energy spectrum of the cosmic radiation in space would be an important factor in trying to figure out how and where cosmic rays were generated, Van Allen took a special interest in investigating the variation of the high-altitude cosmic ray intensity with geomagnetic latitude. For this purpose he took Aerobee rockets to sea aboard the U.S. Navy’s seaplane tender Norton Sound , which had to be specially out fitted with an Aerobee launching tower. Van Allen’s sounding ranged from the geomagnetic equator off the coast of Peru to Alaskan waters.5 The measured variations were sufficiently intriguing that Van Allen pursued the subject further with Rockoons-the small sounding rockets that he launched from Skyhook balloons in the stratosphere. These Rockoon experiments turned up a most interesting and puzzling phenomenon. In the auroral regions above 60 km was a rather soft-i.e., moderately penetrating-radiation that could be a mixture of charged particles and x-ray photons.6 This radiation was assumed to be in some way connected with the auroras, and efforts were begun to explore the connection.
At about this time the appearance of the International Geophysical Year satellite program gave Van Allen the chance to extend these investigations to even higher altitudes. When the first Explorer was launched (31 January 1958), Van Allen’s counters appeared to show a zero counting rate at, certain locations, which didn’t seem to make sense. Further study showed, however, that actually the counters were saturating because of ambient radiations far exceeding intensities with which the counters had been expected to cope. Explorer 3 (26 March 1958) pursued the question.
Soon Van Allen decided that he was observing a region of intense radiation surrounding the earth at high altitude, and on 1 May 1958 he announced his discovery.7
The region at once became known as the Van Allen Radiation Belt. Soviet measurements in Sputnik 3 (15 May 1958) confirm this discovery.
An explanation was quickly forthcoming. The radiations were attributed to charged particles caught in the earth’s magnetic field, unable to escape because their energies were too low to allow them to cross the surrounding field lines. One thus visualized trapping regions within the earth’s field and spoke of trapped radiations. Suddenly it was crystal clear that the earth’s magnetic field, which could prevent some charged particles in interplanetary space from ever reaching the earth, could also prevent other particles already near the earth from leaving.
In retrospect it seemed remarkable that the existence of the radiation belt had not been anticipated long before its discovery. Workers concerned with the problem of how gases escaped from the atmosphere understood that the magnetic field would hinder the escape of ions.8
More significantly, the experiments of K. Birkeland and E. Brilche with cathode rays aimed at small magnetized spheres and the half century of theoretical work by Carl Stormer and others on the influence of the earth’s magnetic field on auroral particles and cosmic rays provided a substantial basis for predicting the existence of trapped radiations near the earth.9 Seeking an explanation for the auroras, Stormer had developed a theory of the motion of an electron approaching the earth’s dipole magnetic field from the sun. He showed that such an electron would be deflected by the earth’s field away from the equator to the polar regions, an action that appeared to him to explain the existence of auroral regions or zones at high latitude.
Stormer’s calculations showed that there were regions inside the earth’s magnetic field which such solar electrons could not reach, to which he gave the name “forbidden regions.” Birkeland, with whom the theory had originated, had already demonstrated in the laboratory that electrons would be deflected to the polar regions, a fact Stormer’s calculations nicely brought out.
Later, in the 1930s and after, theorists interested in explaining the geomagnetic-latitude effect observed in cosmic ray intensities, extended Stormer’s work to much higher energy relativistic particles-i.e., particles approaching the speed of light-such as were to be found in the cosmic rays.10
Their calculations also revealed forbidden regions toward the geomagnetic equator and served to explain why cosmic rays increased in intensity with increasing geomagnetic latitude.
These investigations furnish an excellent example of how initial orientation can markedly bias an investigator’s conclusions. To those seeking explanations of the auroras or the cosmic-ray-latitude effect, the orientation was from outside in. Their particles were approaching the earth from great distances. It was natural, then, that the regions which the earth’s magnetic field prevented those particles from entering should be named forbidden regions. While the point was not missed, still the investigators did not focus on the fact that for a particle already within one of those regions, it could be the outside that was forbidden-in other words, a particle of too low an energy already within one of those regions couldn’t get out. What were forbidden regions for particles approaching from the outside were trapping regions for some particles already there.
It was only a tiny step from this realization to the idea that these trapping regions might well be filled with trapped radiations forming a radiation belt around the earth. But no one paid any attention to this possibility until, on the eve of Van Allen’s discovery, S. Fred Singer in discussing magnetic storms touched upon the possibility that regions of trapped radiations might be found at high altitudes around the earth.11 Following Van Allen’s announcement, this field of investigation blossomed forth as researchers vied with each other to learn about the fascinating trapped radiations.12
In the next half-dozen years a new paradigm emerged to characterize the magnetosphere and magnetospheric physics. Whereas before the spring of 1958 the space environment immediately surrounding the earth was thought to be relatively uncomplicated, it soon became clear that the recently discovered magnetosphere was extremely complex. Before the recognition of the radiation belts, there was no generally accepted picture of the space environment near the earth. Students of the earth’s upper atmosphere and ionosphere tended to think of these as attenuating more or less exponentially with altitude, eventually merging at some considerable, but unknown, height with the medium of interplanetary space. Around the planet the earth’s magnetic field was visualized as essentially that of a dipole, much as depicted in figure 3 in chapter 6. It was known that particles from the sun swept across the earth’s atmosphere, some of them causing the auroras. Sidney Chapman, V. C. A. Ferraro, and others supposed that some of the solar particles impinging upon the earth’s magnetic field would compress it, thereby causing the sudden increase in the surface field that had long been observed to follow flares on the sun. Such a theory implied, of course, that the earth’s magnetic field would be distorted somewhat by the solar particles. Moreover, to explain the main phase of magnetic storms in which the field dropped well below normal for a day or more, Chapman and Ferraro thought of the cloud of solar particles as somehow setting up a ring current around the earth; the current generated a magnetic field that caused the considerable drop in field intensity an hour or so after the sudden increase of the initial phase of the storm. The cloud of solar particles was presumably a plasma; that is, a gas composed of equal numbers of positively and negatively charged particles. Thus, the plasma, though neutral in the large, would be highly conducting. Also, since the positive particles would be deflected in one direction by the earth’s magnetic field, the negative particles in the opposite, one could sense intuitively how a current might be set up around the earth although there were formidable difficulties to overcome in developing such a theory. The period of one to several days required for the field to return to normal would then be the time required for the ring current to dissipate.
Chapman and Ferraro visualized the ring current as flowing on the surface of a huge cavity which the earth’s magnetic field carved out of the plasma cloud as it swept by the earth. There were, of course, two sides to this coin. From one point of view the earth’s magnetic field generated a cavity in the flowing plasma. From the other point of view, however, one could think of the plasma cloud as confining the earth’s field to the cavity region. The discovery of the radiation belt focused attention on the second point of view, and the region within the Chapman-Ferraro cavity became known as the magnetosphere (fig. 31).
Because of the intense interest in the new topic, many of NASA’s early spacecraft-and those of the USSR, also-were instrumented to make measurements of the particles and fields in the vicinity of the earth and in interplanetary space. By the end of 1964 a highly detailed picture of the magnetosphere had been worked out, a picture that was still evolving.13 Explorer 1 measurements put the radiation belt at about 1000 km above the equator, and Explorer 3 and Sputnik 3 confirmed this observation. From Explorer 4 and the space probe Pioneer 3, Van Allen could show that, at least for particles that could penetrate one gram per square centimeter of material, there were two radiation belts, an inner zone and an outer zone as shown in figure 32. Pioneer 4, which eventually went into orbit around the sun, gave additional information about the extent of the radiation belts. It appeared that the belts extended to about 10 earth radii from the center of the earth, but the exact location of the outer edge appeared to be variable.
The variability was quickly tied to conditions in interplanetary space, which in turn were controlled by solar activity. A major factor influencing the earth’s space environment was shown to be the solar wind. In 1958 Eugene Parker had shown theoretically that the sun’s corona had to be expanding continuously, and that a continuous wind from the sun should be blowing through interplanetary space.14 Highly conducting and virtually free of collisions among the constituent particles, this solar wind should entrap and draw out magnetic field lines of the sun. Such interplanetary plasma fluxes of about 108 particles per square centimeter per second were measured by Gringauz on Lunik 2 and 3. 15 With a probe on Explorer 10, H. Bridge and coworkers at the Massachusetts Institute of Technology confirmed the fluxes detected by the Luniks and found that the wind came from the general direction of the sun at about 300 km per second.16 More definitive measurements from Mariner 2 and Explorer 18 showed a very gusty wind, nearly radial from the sun, to be blowing at all times with velocities of roughly 300 to 500 km per second. Protons and helium nuclei appeared to be present in the wind.17
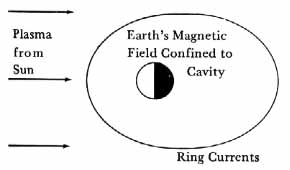
Chapman-Ferraro cavity. Ring currents set up around the earth were assumed to be the cause of magnetic field effects observed during magnetic storms.
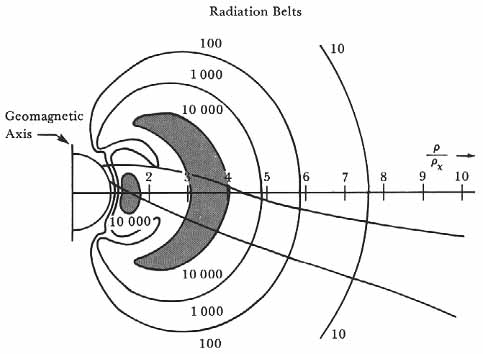
Radiation belts. Van Allen’s picture of the inner and outer zones of the radiation belt made after Pioneer 3 data returns. J. A. Van Allen and L. A. Frank, from Nature 183 (1959). 430; copyright Macmillan Journals Ltd., 1959.
Meantime more information had been collected on the structure of the radiation belts. The inner zone was shown to be largely high-energy protons, many of which could be accounted for by the decay of neutrons splashed back from the atmosphere.18 The neutrons were generated by cosmic rays colliding with nitrogen or oxygen nuclei of the air; being neutral, the neutrons could move upward unhindered by the magnetic field. But the neutrons decayed quickly and produced protons and electrons which, being charged, were trapped to form a part of the radiation belt. Detailed measurements revealed that both protons and electrons existed throughout the altitude range from the bottom of the so-called inner zone to the far edge of the outer zone. The apparent existence of two belts had been due to the insensitivity of some early instruments to lower-energy particles.
The boundary of the magnetosphere was first definitely located with instruments on Explorer 10,
which was launched on 25 March 1961. The spacecraft was projected at an angle of roughly 130 degrees from the direction to the sun, that is, quartering away from the sun. Between the distances of 22 earth radii and the apogee of 47 earth radii, the satellite appeared to cross the boundary at least six times, suggesting that the boundary wavered in the wind. Inside the boundary the magnetic field was 20 to 30 gammas and steady, and there was no detectable plasma. Outside the boundary, however, the field weakened to between 10 and 15 gammas, and plasma was always observed. Data from Explorer 12 in the direction of the sun showed a very sharp outer limit to the geomagnetic field, a limit that came to be called the magnetopause. Beyond the magnetopause was a region in which the magnetic fields were variable in direction and intensity, and the ambient radiation isotropic.19
Thus, by about the beginning of 1962, scientists began to envision a magnetosphere much as shown in figure 33. A continuous solar wind blowing against the earth’s magnetic field was pictured as sweeping around the earth, confining the field to an immense cavity which extended to about 10 earth radii in the direction toward the sun, and to considerably more than this in the opposite direction. Inside the cavity lay the Van Allen Radiation Belt which showed considerable structure, with high intensities of energetic protons in the inner portions and large quantities of electrons in the outer reaches. Outside the magnetopause that is, outside the boundary of the cavity-lay a region of turbulent magnetic fields and plasma. It was suggested that surrounding the turbulent region would be found a huge shock wave produced in the solar wind by the earth’s magnetic field, which would act upon the high-speed plasma much as a blunt body would act upon a supersonic flow of gas in ordinary aerodynamics. By analogy with aerodynamics, estimates were made of where the bow shock might be found.
The bow shock was first detected by instruments in the Interplanetary Monitoring Platform, Imp 1, otherwise known as Explorer 18, which was launched in November 1963 into an orbit with an apogee at 30 earth radii.20 In the course of its lifetime the spacecraft’s instruments provided clearcut evidence that Imp 1 had crossed the magnetopause and the bow shock many times. The data from a magnetometer installed by Norman Ness of the Goddard Space Flight Center were most convincing.21 Figure 34 shows magnetic field data from orbit 11 of Imp 1 . Inside 13.6 earth radii, a well-ordered field was noted, but from 13.6 to 20 earth radii the field was quite turbulent. Beyond 20 earth radii the field became quite steady at about 4 gammas, with some fluctuation in direction. The turbulent region from 13.6 radii to 20 earth radii was interpreted as a transition region between the shock wave in the solar wind and the magnetopause bounding the geomagnetic field. Plasma data from MIT and Ames Research Center instruments were consistent with this interpretation.22 Beyond 20 earth radii the MIT instruments showed large fluxes in only one of six energy channels, presumably that due to the solar wind, whereas in, the transition region the plasma probe indicated considerable turbulence, showing appreciable fluxes on all six channels of the instrument.
In December 1963 Imp 1 found the interplanetary magnetic field, which was usually quite steady, to be disturbed, rising to about 10 gammas for a day or more. On the first day of this disturbance, 14 December, the moon was close to lying between the satellite and the sun. Ness originally attributed this unusual disturbance to a wake produced by the moon in the solar wind.23 That the moon with almost no magnetic field should produce a wake detectable so close to the earth at once suggested that the much larger earth with a strong magnetic field would produce a similar wake reaching certainly to the orbit of the moon, and most likely well beyond. It began to appear that the earth’s magnetospheric tail should extend to very large distances in the antisolar direction.
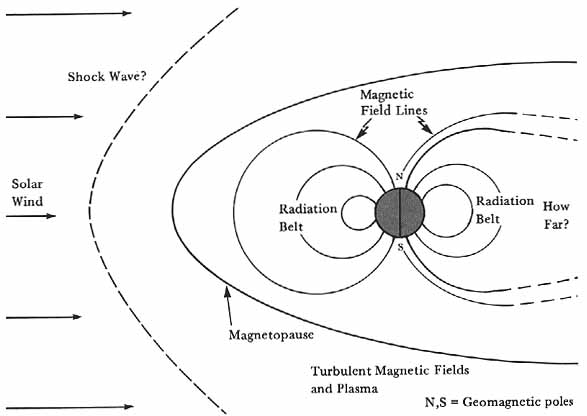
The magnetosphere as visualized early in 1962. Here and in figure 35, the lines emanating, from earth represent magnetic field lines. Although the general structure was emerging many features were still to be delineated.
As investigation of the magnetosphere proceeded, it was clear that this region was intimately involved in many familiar phenomena, such as magnetic storms and auroral displays, serving in some way as a connecting link between the original solar radiations and the ultimate terrestrial effects. But the precise mechanisms involved eluded explanation. It was shown that both electrons and protons produced the auroras, with electrons of energies below 25 kiloelectron volts contributing most to the auroral emissions.24 Stormer’s theory that these particles came directly from the sun into the auroral regions of the earth had to be abandoned when both Soviet and U.S. deep-space probes showed that the fluxes of such particles in interplanetary space were insufficient. An alternate theory that the particles were accumulated in the trapping regions of the magnetosphere and then dumped or dribbled into the auroral zones to produce the auroras also ran into difficulties. Although both Soviet and U.S. measurements showed that the fluxes at the altitudes from which the particles could spiral along the field lines into the auroral regions were adequate to produce an aurora, the quantity of radiation was too low. The particles would be drained away in a few seconds, whereas auroras often lasted for hours.25 Brian O’Brien observed, however, from instruments in Injun satellites of the State University of Iowa that trapped electrons in the radiation belt, electrons precipitated into the atmosphere of the auroral zone, and auroral light emissions all increased simultaneously.26 One could conclude that the disturbances ultimately causing the auroras somehow also replenished the radiation belt, perhaps in this way making it possible to sustain a long-duration auroral display. Whether these additional electrons were inserted into the radiation belt from outside or came from lower energy electrons already existing within the belt and accelerated by some mechanism to the necessary higher energies was not known. Indeed, while many clearcut relationships between auroras and radiation belt activity had been established, at this stage the actual mechanism producing the auroras remained a mystery.
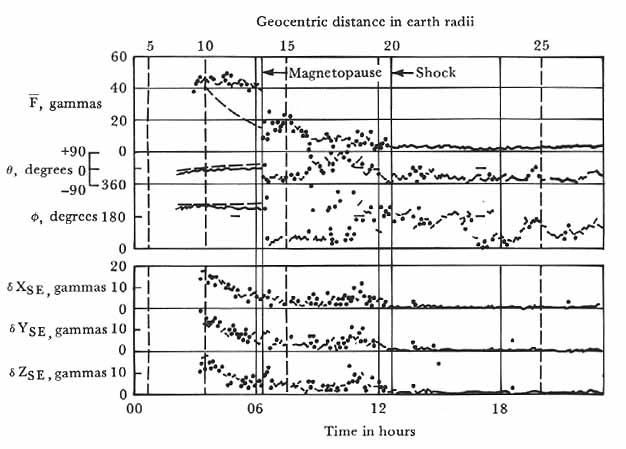
Magnetospheric bow shock as revealed by space-probe measurements. Magnetic field data from orbit 11 of Imp 1. The magnetopause is at 13.6 earth radii. The second transition at 20 earth radii to an ordered field outside is the location of the bow shock wave. C. S. Scearce and J. B. Seek, Journal of Geophysical Research 69 (1964). 3531-69; copyright American Geophysical Union, 1964.
Also unexplained was the immediate cause of the main phase of magnetic storms. A ring current around the earth continued to be the most likely candidate, but how such a current was generated remained a puzzle. It could be shown that charged particles in the magnetosphere, in addition to spiraling around magnetic field lines bouncing back and forth between northern and southern reflection points, would also tend to drift longitudinally, the electrons drifting eastward and the protons westward.27 Thus, these drift motions produced in effect a ring current, which S. Fred Singer suggested as the cause of the main phase of magnetic storms.28 By the end of 1964, however, no spacecraft measurements had been able to locate the postulated ring current.
By the mid-1960s a very detailed, though by no means complete, picture of what the magnetosphere was like had evolved, as illustrated in figure 35 . In the magnetospheric paradigm of 1964 the existence of the solar wind had been established. The wind consisted of protons mostly, with some alpha particles (helium nuclei), both of which had been observed. To be neutral the wind had to include equal numbers of electrons, but these had not been detected as yet. Embedded in the solar wind was an interplanetary magnetic field pulled out of the sun by the solar wind plasma. Near the earth the interplanetary field intensity was between five and six gammas. Blowing against the earth’s magnetic field, the solar wind produced a huge shock wave sweeping around the earth much as an aerodynamic shock wave accompanies a supersonic airplane. But, whereas an aerodynamic shock wave is produced by compression of a gas consisting of air molecules all colliding with each other, the magnetospheric shock wave was set up by deflection of the individual plasma particles by the earth’s magnetic field and was referred to as a collisionless shock wave.
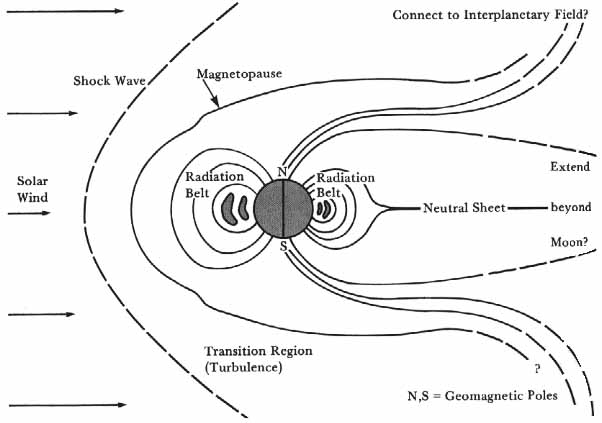
The magnetosphere as visualized in the mid-1960s. Space-probe measurements have provided a wealth of detail. The principal research problems r, shifting from describing the phenomenon to explaining the relationships and processes.
Behind the shock was a region of turbulence. Here the magnetic fields became highly disordered; particle velocities, which in the solar wind were usually confined to a rather narrow range, suddenly varied widely. Closer to earth this transition region was bounded by the magnetopause enclosing the geomagnetic field now grossly distorted from the simple dipole configuration that would have existed in the absence of a solar wind. Some of the field lines that would otherwise have lain on the sun-ward side of the earth were swept backward in the antisolar direction and along with field lines on the night side were extended into a magnetospheric tail. The magnetic field lines that still enveloped closed regions near the earth contained the Van Allen Radiation Belt, which paradoxically appeared to be more limited in extent on the night side of the earth than on the daytime side, where the field was compressed by the solar wind. On the dayward side, toward the poles, where some of the field lines were swept out into the tail, appeared a cusp or dimple in the magnetopause. It was thought that where magnetic field lines of opposite direction came together near the equatorial plane of the tail, they might cancel each other producing a neutral sheet. Along this neutral sheet one could envision charged particles leaking from interplanetary space into the zones closer to earth, where they could then be steered by the field toward the poles.
In the steady state this magnetospheric configuration drifted slowly around the earth, always keeping the tail away from the sun as the earth revolved around the sun. The nose of the shock wave was about 14 earth radii from the center of the earth, and the nose of the magnetopause typically at about 10 earth radii. The extent of the magnetospheric tail was a matter of speculation, but it appeared certain to reach at least to lunar distances.
At times when the sun was disturbed, the magnetosphere and the radiation belts were affected. The spatial extent of the magnetosphere varied appreciably and trapped radiations were enhanced. following solar storms. There was a question as to whether during these disturbed conditions new particles were injected into the radiation belt or energy was transferred by hydromagnetic waves from the interplanetary plasma to particles already in the magnetosphere.
Many problems, of course, auroras appeared tantalizingly remained unsolved. An explanation of the close, yet elusive. The immediate cause of the main phase of magnetic storms was still to be found. How energy and particles were inserted from the, interplanetary medium into the magnetospheric regions had yet to be explained. The existence of the neutral sheet had not been established, nor had its precise role in magnetospheric physics been described. How the field lines in the magnetospheric tail closed again also had yet to be described. Did they perhaps connect with magnetic field lines in interplanetary space, as some surmised? Related questions concerned the sun. How did the sun manage to eject the streams and clouds of highly energetic particles and magnetic fields that from time to time upset the normal conditions in the solar wind? There was reason to suppose that solar magnetic fields were the ultimate source of the energy conveyed to these clouds, but there was as yet no generally accepted explanation.
Most of the early research on the magnetosphere was directed toward describing it. As the subject became more familiar, more and more attention was devoted to achieving a coherent explanation of the magnetosphere and its relationship to the sun and interplanetary medium on the one hand, and to terrestrial phenomena on the other. By 1964 the major interest of the scientists lay in trying to understand the various processes in magnetospheric physics. There was, of course, still much to learn about what the magnetosphere and its most important phenomena were. But enough of the what had been learned that now investigators could profitably spend much of their time on the how, the immediate and ultimate causes of the auroras, magnetic storms, radiation belts, and the magnetospheric tail, and on the processes that related causes with effects. To understand these processes would be the principal objective of magnetospheric research in the years ahead.
SIGNIFICANCE
Clearly the discovery of the earth’s radiation belt and the subsequent description developed for the magnetosphere constituted a major scientific achievement. It is natural, then, to ask what the significance of the achievement might be. Was magnetospheric physics really a new field of research, as some claimed? Did Van Allen’s discovery set in motion a scientific revolution, or was the unveiling of the magnetosphere simply normal science? The attempt to answer these questions provides a good illustration of the difficulties in Kuhn’s concepts of paradigm, normal science, and scientific revolution.
As to whether magnetospheric physics was a new field of research, certainly before the discovery of the radiation belt no one was consciously working on investigating the magnetosphere, since the existence of such a region was unknown. Following Van Allen’s experiments, scores of researchers began to investigate the magnetosphere. One could then legitimately argue that here was indeed a new field of research, not being pursued before, now being pressed vigorously. But this seems too shallow a conclusion. For research on the earth’s magnetic field, the auroras, sun-earth relationships, and cosmic rays had been of long standing when Explorer 1 went aloft. From this, magnetospheric physics appears more as simply one aspect of those other fields-a remarkable and hitherto unforeseen aspect, to be sure, but integrally related.
Did, then, the unveiling of the magnetosphere constitute a scientific revolution in the related scientific fields? Certainly the magnetospheric paradigm that emerged from the first half-dozen years of satellite and space-probe research was new and unpredicted. One is tempted, then, to argue that the emergence of this entirely new paradigm was evidence of a scientific revolution. But again the quick answer may be too superficial. True, the trapped radiations and the magnetosphere as it was revealed were unpredicted. But that is not the criterion of a scientific revolution. One must ask instead whether the radiation belt and the magnetosphere were unpredictable from the existing paradigm in the sense of being fundamentally inconsistent with it. The answer to this question may well be no. In fact, the work of Stormer and others, based wholly on the existing paradigm, had provided an adequate basis for predicting the existence of trapped radiations in the earth’s magnetic field. In this light the new magnetospheric paradigm appears as a straightforward extension of the previously existing paradigm, requiring no changes in fundamental principles or concepts. From this perspective, then, the magnetospheric research of the early 1960s was normal science-exciting, productive, important, yet normal science. But magnetospheric physicists are likely to consider the above perspective too broad. Norman Ness, one of the key figures in magnetospheric research, regards the progress made in the half-dozen years following the discovery of the radiation belts as revolutionary. In this assessment Ness considers the emergence of a new magnetospheric paradigm and the fact that no one predicted it as of primary significance.29
One major implication of the research on the earth’s magnetosphere-which was immediately recognized-was that the way in which the interplanetary medium affects a planet depends strongly on whether the planet has a magnetic field. In a period when the idea of comparative planetology was being emphasized by the availability of spacecraft to carry scientific investigations to the different planets, scientists previously interested in sun-earth relations were beginning to talk about sun-planetary relations. It had already appeared as though the moon produced a detectable wake in the solar wind, although later measurements by Explorer 35 would show that the lunar wake extends only a few lunar radii downstream, instead of to the vicinity of the earth as originally supposed.30 The moon presented the case of a planetary body with very little magnetic field and no atmosphere. Solar wind particles might be expected, then, to strike the lunar surface directly. In the case of Venus, which also has little magnetic field but which has an atmosphere perhaps 100 times that of Earth, the solar wind would impinge on the top of the atmosphere but would not be able to reach the planet’s surface. Mars would present the case of a planet with little magnetic field and an atmosphere about one percent that of Earth. Jupiter, on the other hand, with its very strong magnetic field would have a huge magnetosphere. If radio bursts that were observed to come from Jupiter were from trapped particles, the Jupiter radiation belt would prove much more intense than Earth’s. At the end of 1964 these were principally ideas for future research. Knowledge of Earth’s magnetosphere invested that future research with considerable promise.
SATELLITE GEODESY
Satellite geodesy also made a substantial contribution to the deepening perspective in which men could view their own planet. But the new perspective differed in an interesting way from that provided in magnetospheric physics. For the latter, rockets and satellites revealed a wide range of hitherto unknown phenomena. In contrast the subject matter and problems of geodesy were well known; it was increased precision, the ability to measure higher order effects, and the means for constructing a single global reference system that space methods helped to provide.
Geodesy may be divided into two areas: geometrical geodesy and dynamical, or physical geodesy. The former seeks by geometrical and astronomical measurements to determine the precise size and shape of the earth and to locate positions accurately on the earth’s surface. The latter is the study of the gravitational field of the earth and its relationship to the solid structure of the planet. As will be seen, geometrical and physical geodesy are intimately related.
Geodesy offers many practical values. Accurate maps of the earth’s surface depend on a knowledge of both size and shape. Into the 20th century the requirements for precision were rather modest. Individual countries could choose their own reference systems and control points and, using geodetic measurements made within their own territories, produce maps of sufficient accuracy for national purposes. The appreciable differences among the various geodetic systems did not appear to matter. As late as 1947, disagreements among Danish, Swedish, German, Norwegian, French, and English systems ranged from 95 meters to 250 meters, while in the absence of adequate surveys, errors between the various continents and ocean islands could be a kilometer or more.31 For demands in the mid-20th century, the most obvious being those of air and, marine navigation and missilery, such errors could at times appear enormous, and there was a growing agitation among geodesists to generate a world geodetic system that would use a common reference frame and tie all nets around the world into a single system. At this point the artificial satellite appeared on the scene and was able to provide some help. To understand how the satellite could contribute, a few basic concepts are needed.
The science of geodesy began when the Greek Eratosthenes (c. 276-c. 192 B.C.), believing the earth to be spherical, combined astronomical observation with land measurement to estimate the size of the globe (fig. 36).32 He had learned (actually incorrectly) that at noon in mid-summer the sun shown vertically down into a well in Syene (now Aswan). Observing that at the same time the sun as seen from Alexandria was 7.2° south of the zenith, he concluded that the arc along the earth connecting Syene and Alexandria had to subtend an angle of 7.2° at the earth’s center. The arc accordingly had to be 7.2/360 or 1/50 of a total meridian circle. He was told that a camel caravan took 50 days to travel from Alexandria to Syene. Using a reasonable camel speed he deduced a length for the arc, which multiplied by 50 gave him a rough estimate (16% too large) of the length of a whole meridian circle. Such estimates of the earth’s dimensions improved over the centuries as different persons used better measurements, and eventually better techniques.
Concerning techniques, the next major step in geodesy came when Tycho Brahe conceived of the method of triangulation, which was developed into a science by Willebrord Snell. In this technique (fig. 37) the points A and P, between which the distance is to be determined, are connected by a series of interlinking triangles. The length of one side of one of the triangles that is convenient to measure-say the side AB of the first triangle-is then measured to a high degree of accuracy. One then measures the angles of the first triangle, which can be done with precision much more easily than measuring length. Using the law of sines, the initial side of the next triangle down the chain can then be calculated. The process can be repeated to get the length of the initial side of the third triangle of the chain. Moving step by step from triangle to triangle, one finally gets to the last triangle, of which P is a vertex. With the lengths of all the sides of the triangles known, it is then possible to compute the distance between A and P along the terrestrial sphere. For great distances one must, of course, introduce appropriate corrections to take into account that the sum of the angles of a triangle on a sphere is greater than 180°. With care a high degree of accuracy can be achieved. By using nets of triangles one can proceed outward along one chain to the selected point P, and back along a different chain to calculate the measured baseline AB. If the calculated value of AB is sufficiently close to the originally measured value, the confidence in the calculated value of AP can be high. Jean Picard (1620-1682) employed this technique in obtaining the value of the earth’s radius that Isaac Newton used in deriving his law of gravitation.
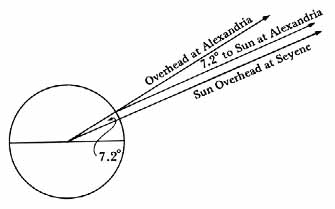
Eratosthenes method for measuring the circumference of the earth.
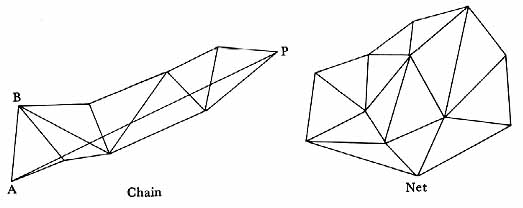
Triangulation. This technique provided a step-by-step method of accurately determining the distance between widely separated points on the earth’s surface.
The period from Eratosthenes to Picard has been referred to as the spherical era of geodesy. During that time it was assumed that the earth was a sphere. This made the geodetic problem quite simple, for one had only to determine the radius of the terrestrial sphere, and the rest came out of simple geometry (spherical trigonometry). But in the 17th century it became clear that the earth was not spherical. From this period on the earth was visualized as essentially an ellipsoid of revolution, with its major axis in the equatorial plane and minor axis along the earth’s axis of rotation. The bulge in the equatorial plane could be explained as due to centrifugal forces from the earth’s rotation. Thus, the 18th and 19th centuries could be thought of as the ellipsoidal period of geodesy, and a prime task was to find the ellipsoid of proper size and flattening to best represent the earth. By the mid-20th century the equatorial radius of the reference ellipsoid had been determined as 6 378 388 meters, while the flattening-that is, the ratio of the difference between the equatorial and polar radii to the equatorial radius-was put as 1/297.33 The tasks of modern geodesy grew out of this historical background.
Those seeking a single geodetic net for the world had to agree on a suitable reference frame. It is natural to take this as a rectangular coordinate system with origin at the earth’s center and three mutually perpendicular axes, one along the earth’s rotational axis and the other two in the equatorial plane. Alternatively one could use spherical polar coordinates locating a point by its distance from the origin of coordinates, and its latitude and longitude. In principle all measurements and calculations could be made in terms of these coordinates without any intermediate reference. To visualize the geometry, however, a reference surface approximating the actual surface of the earth is helpful. The most useful reference surface should satisfy two important criteria. First, it should be of such a size and shape that all locations on the earth are close to the reference. Secondly, the surface should be one on which calculations of positions, angles, and distances are mathematically simple. A sphere would satisfy the second criterion very nicely, since one could use the ordinary spherical trigonometry of air and marine navigation. But for any chosen sphere, many locations on earth would be unacceptably far from the reference. By flattening the sphere at the poles, however, to produce an oblate ellipsoid of revolution, both criteria can be met. For calculations the methods of analytic geometry can be used, and an ellipsoid of the equatorial radius and flattening given in the preceding paragraph-6,378,388 meters and 1/297 respectively-provides a good first order approximation to the actual size and shape of the earth. This ellipsoid of revolution, with center at the origin of coordinates, was often used as reference ellipsoid before the advent of satellites. As will be seen later, satellite geodesy provided an improved estimate of the size and flattening of this reference ellipsoid.
By furnishing the means of accurately positioning different sites and features on the earth, geometrical geodesy provides essential data for map makers, the fixing of political boundaries, civil engineering, and military targeting. But, the data also raise numerous scientific questions, such as why various features are where they are and what forces cause observed irregularities in the shape of the earth. Dynamical geodesy addresses itself to such questions.
Among the factors affecting the shape of the earth are the distribution of matter in the crust and mantle, centrifugal forces due to the earth’s rotation, and gravity. The dominant factor is gravity, and an investigation of the earth’s gravitational field lies at the heart of dynamical geodesy. To understand why, the concepts of geoid and spherical harmonics will be helpful.
First the geoid. To start, consider a simplified case. Suppose the earth to be perfectly homogeneous, plastic, and nonrotating. Then the earth would assume the shape of a perfect sphere (fig. 38). More significantly, level surfaces around the earth would also be perfect spheres. By level surface is meant a surface to which the force of gravity is perpendicular everywhere. At any point on the surface the bubble of a spirit level held tangent to the surface would be centered. A pool of water on a level surface would experience no sidewise, or “downhill,” gravity forces urging the water to flow (and were it not for internal pressures in the water and adhesion to the material of the surface, the pool would stay where it was).
The level surface that coincides with the actual surface of the earth is called the geoid. In the idealized case treated here, the geoid is a perfect sphere.
Now suppose a homogeneous, plastic earth rotates around a fixed axis. In this case the centrifugal forces of the rotation combine with gravity lessening the gravity and causing a bulge at the equator and producing a flattening at the poles (fig. 39). The earth’s figure becomes that of an oblate ellipsoid of revolution, the surface of which is level. If the surface were not level, sideways forces on the plastic material would keep the material flowing until those forces were reduced to zero. Thus, for this case, the geoid is the ellipsoid of revolution comprising the earth’s surface.
Next, return to the nonrotating earth, but this time suppose that near the surface is a large mass of material much denser than the rest of the earth (fig. 40). In this case, near the dense mass the level surfaces are no longer spherical. For, if one imagines holding a spirit level near the intruding mass, its extra gravitational pull draws the fluid of the level toward the mass thus forcing the bubble away. To counter this effect the end of the level nearer the mass must be tipped up to recenter the bubble. In other words, the level surface tips upward as one approaches the mass, thus forming a bulge. In a similar vein, near a mass deficiency, the level surface would show a depression.
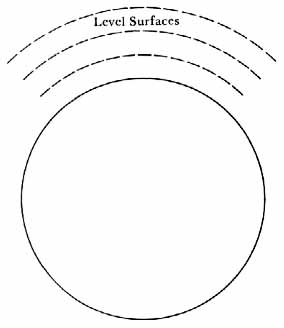
The geoid in the case of a homogeneous, plastic, nonrotating earth. For the idealized case depicted here, the geoid is a perfect sphere.
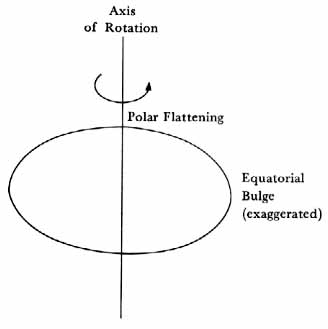
The geoid in the case of a homogeneous, plastic, rotating earth. In this case, also an idealized one, the geoid is a perfect oblate ellipsoid of revolution.
For a rotating, nonhomogeneous earth, the same reasoning applies. Mass concentrations in the crust produce bulges in the geoid while mass deficiencies create depressions (fig. 41). Thus, the actual geoid, which for the real earth is defined as the level surface that over the oceans coincides with mean sea level, furnishes a good means of visualizing variations in the structure of the earth. Since mass and gravity go together, these structural features are revealed in their influence on the earth’s gravitational field, intensifying the field near mass excesses and weakening it near mass deficiencies. These perturbations in the earth’s field produce corresponding perturbations in the orbits of satellites which revolve under the influence of gravity. A precise analysis of these orbital perturbations can yield the features of the field. From these one finally gets back to the geoid and the earth’s structure.
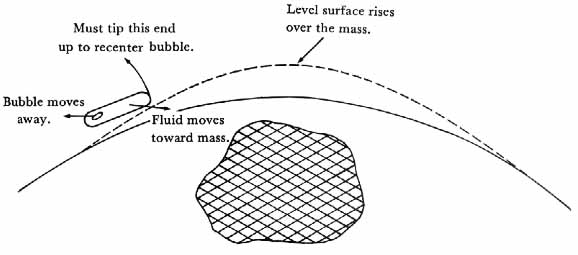
The geoid in the case of a nonhomogeneous, nonrotating earth. Variations in the earth’s density generate bulges and depressions in the geoid.
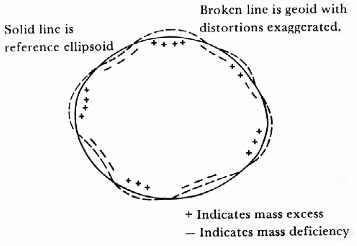
The actual geoid. The real earth’s geoid has numerous bulges and depressions, revealing by their existence appreciable variations in the material of the planet.
Mathematically the earth’s gravitational field can be derived by calculus from what is called the geopotential function ψ. Physically the surfaces over which ψ is constant are the level surfaces discussed earlier in defining the geoid. Thus the makeup of the geoid and that of the earth’s surface geopotential are identical.
The geopotential function can be expressed as the sum of an infinite number of terms (in general). Because these terms can be expressed in sines and cosines of latitude and longitude, they are referred to as spherical harmonics, by analogy with the harmonic analysis of a vibrating string where sines and cosines of the various multiples of the fundamental frequency of the string are used.* The amount of a specific harmonic in the expansion of the geopotential is given by a coefficient Jnm. The most general harmonics correspond to distortions of the geoid in both latitude and longitude. Some, called sectorial harmonics, reveal major distortions in longitude for example, an ellipticity in the earth’s equator. Of special importance are the zonal harmonics, which correspond to coefficients Jnm for which m = 0 and which depend only on latitude. The second zonal harmonic corresponds to the earth’s equatorial bulge caused by the earth’s rotation. The third zonal harmonic, if present in the expansion of the geopotential, would add a pear-shaped component to the earth’s figure, elevating the geoid at one pole and depressing it at the other.
It was in regard to the reference ellipsoid and the coefficients in the spherical harmonic expansion of the earth’s potential that satellite measurements could aid the geodesist. The most straightforward contribution was to provide a sighting point in the sky that could be used to make direct connections between remotely separated points of the earth, supplementing the method of triangulation along the earth’s surface. For this purpose simultaneous sightings of a satellite from two widely separated points were most useful. But once the orbit of a satellite had been accurately determined, simultaneous sightings were not required. One could relate separate sightings by computing the time and distance along the orbit from one sighting to the other, and again proceed to compute the distance between the two observing stations on the earth. By this latter method continental and transoceanic distances could be spanned, clearly a powerful aid in tying together different geodetic nets of the world.
The second major contribution that satellites could make was to help determine the different harmonic components of the earth’s gravitational field, or alternately of the earth’s gravitational potential. The orbit of a satellite is determined completely by its initial position and velocity and the forces operating on it. These forces include the gravitational influences of the earth, sun, and moon; atmospheric drag; solar radiation pressures; and self-generated disturbances such as those caused by gases escaping from the interior of the satellite. For a satellite near the earth yet well out of the appreciable atmosphere, the earth’s gravity controls the orbit, the other effects amounting to corrections that have to be taken into account. As for the earth’s field, Newton’s inverse square law term constrains the satellite to an essentially elliptical orbit. But higher order terms also have their effects. The second order zonal harmonic or equatorial bulge causes the plane of the satellite’s orbit and the line joining apogee and perigee to rotate in space. Still higher harmonics produce slight undulations in the satellite’s orbit, which can be measured and analyzed to determine which harmonics, and how much of each, are producing the observed effects.
The application was simple in principle, but mathematically very complicated. Satellite orbits and their perturbations were directly related to the geoid, while the positions of the tracking stations and geodetic nets were tied to the reference ellipsoid, and a major objective was to improve the quantitative definitions of both geoid and ellipsoid. Because of the complexities, the modern computer was required to take advantage of the satellite opportunities. But with the computer the complexities and important results were quickly sorted out.
Some of the earliest came from the first Sputnik and Vanguard satellites. Using Sputnik 2, E. Buchar of Czechoslovakia was able to make an estimate of the earth’s flattening. From the measured rate of precession of the satellite’s orbit, which could be related mathematically to the flattening, Buchar obtained the value
f = 1/(297.90±0.18) (12)
which is to be compared to the previously accepted value of 1/297. From a more extensive analysis of the Vanguard 1 satellite, workers at the U.S. Army Map Service obtained
f = 1/(298.38±0.07) (13)
while a U.S. Naval Research Laboratory group got virtually the same answer.34
While the measured flattening of the earth was smaller than that which had been in use, it was significantly greater than that which would exist in a plastic earth rotating at the present angular velocity of the earth, namely 1/300.35 The implication was that the earth’s mantle was not perfectly plastic. For a perfectly plastic earth, the flattening indicated by the satellite measurements would correspond to an earlier, faster angular velocity of earth. Instead, changes in the earth’s equatorial bulge lag by a substantial period-tens of millions of years-behind the changes in the centrifugal forces producing the bulge.36
Vanguard 1 data also showed that the eccentricity of the satellite’s orbit varied by 0.00042 ± 0.00003 with a period of 80 days. John O’Keefe and his colleagues concluded that this variation had to be caused mostly by the third harmonic in the earth’s gravitational field. The distortion corresponding to this harmonic was very slight, amounting to only about 20 meters elevation of the geoid at the north pole and an equivalent depression at the south pole-widely described in the newspapers as the earth’s “pear-shaped" component-but was significant in that it might imply a considerable strength in the earth’s interior. O’Keefe and his colleagues estimated that a crustal load 2 x 10⁷> dynes/cm2 (2 x 10⁶ n/m2) was implied by their findings, producing stresses which they said “must be supported by a mechanical strength larger than that usually assumed for the interior of the earth or by large-scale convection currents in the mantle.”37
It was possible by a detailed analysis of the orbital perturbations to derive a chart of the departures of the geoid above and below the reference ellipsoid, a chart which could suggest a great deal about the distribution of mass within the earth’s crust. Using observations from five different satellites, William Kaula of Goddard Space Flight Center produced the chart shown in figure 42.38 The positive numbers give elevations of the geoid in meters above the reference ellipsoid, which was taken to have the flattening of 1/298.24 indicated by satellite measurements. The negative numbers give depressions of the geoid below the reference ellipsoid. As an example of what one can read from such a chart, the elevations and depressions of the geoid shown in the equatorial belt strongly suggest that the earth’s equator is not a circle, but an ellipse. This is consistent with an analysis by C. A. Wagner of data from the communications satellite Syncom 2 in synchronous orbit over the earth’s equator.39 Wagner found a difference of 130 ± 4 meters between the major and minor equatorial diameters, with one end of the major diameter at 19° ± 6° west of Greenwich.
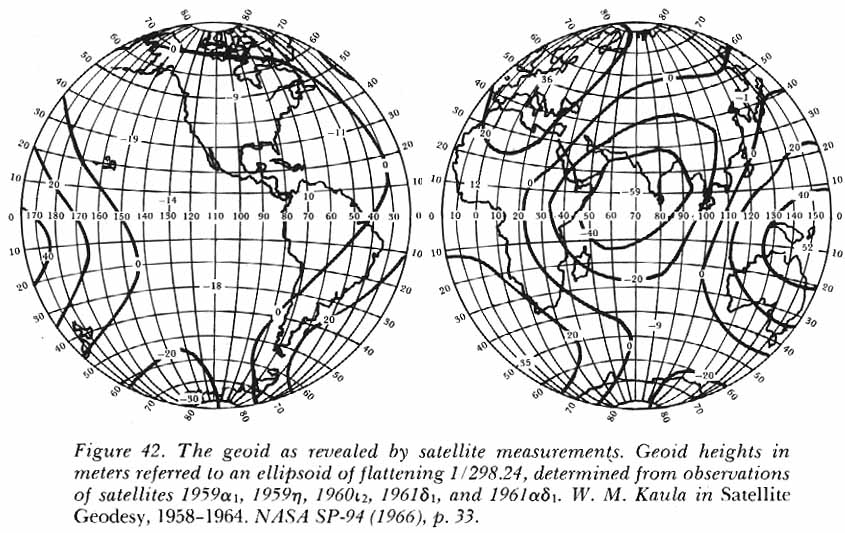
The geoid as revealed by satellite measurements.
While many workers were concerning themselves with physical, or dynamical, geodesy, others were working on the problems of mensuration and mapping. Using the large Echo 1 satellite, French geodesists undertook to check the tie between the French geodetic net and that of North Africa.40 With radio tracking techniques, the Applied Physics Laboratory of the Johns Hopkins University determined distances between stations at various points from the east coast to the west coast of the United States. From comparison of distances measured by ground surveys and those determined by satellite techniques, the APL workers concluded that, with a modest number of satellite passes and four or more observing stations, relative positions of ground stations separated by continental distances could be obtained with a confidence level of about 10 meters.41 Using simultaneous photographic observations of the Anna 1B geodetic satellite taken from different stations, Air Force workers measured distances between stations separated by about 1000 km with good accuracy-better than 10 m. They concluded that their geodetic stellar camera system was “operationally capable of extending geodetic control to proportional accuracy of better than 1/100,000 when cameras in a network simultaneously observe a flashing satellite beacon.”42
SIGNIFICANCE
The power of satellite geodesy was quickly evident, and significant results were forthcoming almost as soon as the satellites were available. Nevertheless, the first half-dozen years after Sputnik must be regarded more as a preparation period rather than as a full flowering of the new technique. One obtained a better estimate of the size and shape of the reference ellipsoid to use for a world geodetic system, and a good start on tying a number of existing networks together by using satellite triangulation. But most of the work of establishing a worldwide system had yet to be done.
Accuracies measured in meters were achieved in the early work, but these were far from the precision for which one could foresee a need and of which the satellite approach ought to be capable eventually. For some applications to oceanography, such as the determination of circulations and their causes, measurement of heights of the sea surface (which is not always at mean sea level) would be required to within centimeters, and correspondingly the altitudes of orbiting satellites to a comparable precision. To follow the motions of tectonic plates making up the earth’s crust, and the drifting of continents-a few to perhaps 10 centimeters a year-comparable accuracy would be needed. The military services also had requirements for greater accuracy in geodetic measurements, not so much in the positioning of strategic locations around the world relative to each other as in the determination of higher order harmonics of the earth’s gravitational field, which would affect the orbits of navigation and photographic satellites and the accuracy of long-range missiles. And the precise determination of the earth’s field was of major scientific interest, being directly related to the structure and processes within the earth’s crust and mantle, which in turn were probably connected with the causes of tectonic plate motions and continental drift. To obtain the great precision needed for such applications, many years of theoretical work and practical experience with the new geodetic techniques still lay ahead.
The power of satellite geodesy for gravitational field studies lay in the different avenue of approach it afforded from that of ground-based geodesy. For example, to locate the geoid from surface observations one might start with measurements of the deflection of the vertical from the normal to the reference ellipsoid. But the normal to the geoid surface (fig. 43), which is the direction of gravity at the point in question, usually differs from the direction of the perpendicular to the surface of the reference ellipsoid. The deviation is determined by astronomical measurements, using the stars as a fixed reference system in space. From the angle between the normals to the geoid and the reference ellipsoid at a chosen point, one can deduce for any direction along the ellipsoid’s surface the slope of the geoid relative to the ellipsoid. By integrating this slope along various arcs the departure of the geoid above and below the ellipsoid of reference can be obtained. Tremendous quantities of data are needed to construct a chart of the geoid for the whole earth, or even for large regions. Furthermore, the technique cannot be applied over the oceans.
In the satellite orbit, nature has already done the integrating that the ground-based geodesist must do in depicting the geoid. For the motion of the satellite in its path is the result of the collection of forces operating on the spacecraft, the dominating one being that of the earth’s gravity. Thus, the satellite geodesist has in the orbital data a worldwide picture of the geoid, his task being to sift out the different harmonics as an aid to visualizing the structure of the gravity field. The two approaches are in a sense from opposite directions. The ground-based geodesist starts from bits and pieces of the total picture and tries to reconstruct the total from those pieces. In contrast the satellite geodesist starts with an integrated effect and tries to discern from the total what the key building blocks are.
It had been extremely difficult to determine the higher harmonics in the earth’s field from ground observations. But in a few years artificial satellites produced a respectable number of the more important harmonics. By the mid-1960s reasonably consistent values of the zonal harmonics J2 (= J2.0) through J7 (= J7.0) had been obtained by several different persons, and a number of the more general coefficients-for example, J22, J31, J32, J33, J41, J43, J44 - had been computed. 43
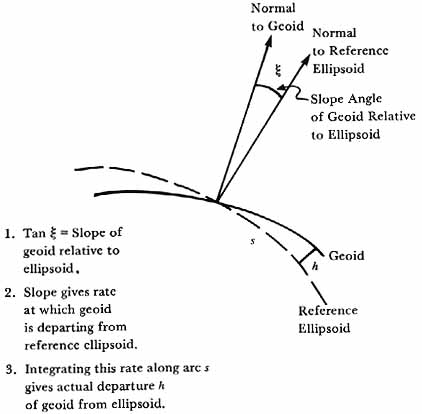
Determining the geoid from ground-based measurements. (1) Tan f is the slope of the geoid relative to the reference ellipsoid. (2) The slope gives the rate at which the geoid departs from the ellipsoid as a function of distance along the ellipsoid. (3) Integrating this rate along arc s gives the actual departure h of the geoid from the ellipsoid.
In view of such successes it is natural to ask if satellite geodesy was destined to supplant ground-based geodesy. The answer to this question must be no. just as sounding rockets continued to be essential for upper atmospheric research even after the satellite was available, so ground techniques, the power of which was greatly strengthened by the development of long-baseline interferometry using fixed sources in the sky like pulsars, remained essential to geodesy. In fact, over the years ahead geodesists would be discussing the necessity of combining ground-based and satellite methods to achieve required accuracies.
Nevertheless, satellite geodesy injected a remarkable stimulus into the field. By 1964 the world’s astronomers were seriously considering incorporating the new results from satellite geodesy into the international system of astronomical constant.44 As with the magnetosphere, one is led to ask if such actions, along with the impressive results flowing from geodetic research with satellites, did not indicate a scientific revolution in the field. Satellite geodesists could indeed think and speak of their work as “revolutionary.”
As John O’Keefe observes, the satellite results had forced the abandonment of what had previously been accepted as the basic hypothesis of geodesy. In brief, the hypothesis held that there are no extensive areas on earth in which the difference between the earth’s gravity and the gravitational field to be expected from a uniform ellipsoid is of a single algebraic sign. The basic hypothesis stemmed from the concept of isostasy, in which the earth was supposed to have an essentially plastic mantle in which stress differences would promptly be relieved. But satellite measurements revealed that there are substantial low-order harmonics in the earth’s field, casting serious doubt on the idea of a plastic mantle, and imposing serious limits on the idea of isostasy. In O’Keefe’s own words:
The Vanguard results swept this whole philosophy into limbo. Stress differences clearly existed in the mantle. Isostasy was not true on a large-scale, at least not to the extent demanded by the Basic Hypothesis of Geodesy.
The meaning of this revolution in geodesy is not yet clear in terms of geophysics. We know that the hydrostatic assumption (isostasy) is not as good as we thought; but what takes its place? Hydrostatic equilibrium means that the earth behaves like a liquid at rest; that is not good enough; but is it because the earth is a liquid in motion (i.e., convecting) or is it because the earth can be thought of as a solid (i.e., having a non-zero ultimate strength)? …The ambiguity here has tended to obscure the significance of the revolution in geodesy… The geodetic significance of the satellite revolution is clear; there are substantial low harmonics, and isostasy has very serious limits as a mode of describing the large-scale behavior of the earth. The Basic Hypothesis is false.45
Finally it must be noted that the expanded perspective afforded by satellite geodesy applied not only to the earth. The techniques that were proving so useful in the study of the earth would obviously be effective in investigating the moon and planets. Indeed, it was clear that a very long time would elapse before extensive ground-based geodesy could be practiced on another planet. For the foreseeable future satellites would have to be the principal tool of lunar and planetary geodesy. Fortunately circumstances had provided a considerable opportunity to practice with this new tool before lunar and planetary orbiters would be in operation. But there was little time to spare. By the end of 1964 the Lunar Orbiter was getting ready to go.
By the middle of the 1960s the sounding rocket and instrumented spacecraft had proved themselves to be revolutionary new tools for scientific research in the sense that they had made possible investigations and discoveries not possible at the ground. They had allowed men to look back on the planet from a new vantage point in space, enhancing the perspective in which one could view the earth. This perspective would continue to deepen as spacecraft and men reached other planets, making it possible to study the earth not as the only accessible planet but as one of many like objects. Broadly, these investigations might be regarded as normal science. But many scientists considered the impact of space science on both magnetospheric physics and geodesy as revolutionary, especially in the frame-work of the individual discipline. In any event, the degree to which space studies enriched those sciences was inspiration to the scientists and a satisfying return on the investments of the countries that supported the work.
- More completely, like the sines and cosines, the basic functions out of which spherical harmonics are constructed form what mathematicians call an orthogonal set.
Source Notes
- Significant Achievements in Satellite Meteorology, 1958-1964 , NASA SP-96 (Washington, 1966); William K. Widget, Jr., Meteorological Satellites (New York: Holt, Rinehart and Winston, 1966).X
- Ecological Surveys from Space, NASA SP-230 (Washington. 1970); Richard S. Williams, Jr., and William D. Carter, eds., ERTS-1:A New Window on Our Planet , Geological Survey Professional Paper 929 (Washington: U.S. Geological Survey, 1976).X
- John O’Keefe, “Geodetic Significance of an Artificial Satellite,” appendix to the American Rocket Society Space Flight Committee, “Utility of an Artificial Unmanned Earth Satellite ,” Jet Propulsion 25 (Feb. 1955): 71-78; John O’Keefe and C. D. Batchelor, -Perturbations of a Close Satellite by the Equatorial Ellipticity of the Earth,” Astronomical journal 62 (1957): 183.X
- A. V. Gangnes, L. F. Jenkins, Jr., and J. A. Van Allen, “The Cosmic Ray Intensity above the Atmosphere,” Physical Review 75 (Jan. 1949): 57-69.X
- J. A. Van Allen and S. F. Singer, “On the Primary Cosmic Ray Spectrum,” Physical Review 78 (June 1950):819; erratum, ibid., 80 (Oct. 1950):116.X
- J. A. Van Allen, “Rocket Measurements of Soft Radiation.” in Annals of the International Geophysical Year , 12, pt. 2. ed. Homer E. Newell, Jr., and Leonard N. Cormier (London: Pergamon Press, 1960): 646-50.X
- Paper presented by Van Allen at joint meeting of National Academy of Sciences and American Physical Society on 1 May 1958. See also, Van Allen, G. H. Ludwig, E. C. Ray, and C. E. McIlwain, “The Observation of High Intensity Radiation by Satellites 1958 and,” Annals of the IGY , 12, pt. 2 (1960): 671-81.X
- S. K. Mitra, The Upper Atmosphere (Calcutta: Royal Asiatic Society of Bengal, 1947), pp. 27-29.X
- K. Birkeland, Arch. Sci. Phys. 1 (1896): 497; E. Brüche, “Some new theoretical and experimental results on the aurora polaris.” Terrestrial Magnetism and Atmospheric Electricity 36 (1931):41-52; C. Stormer, “Twenty-five Years’ York on the Polar Aurora,” Terrestrial Magnetism and Atmospheric Electricity 35 (1930): 193-208.X
- P. S. Epstein, “Note an the Nature of Cosmic Rays,” Proceedings of the National Academy of Sciences, U.S . 16 (1930): 658-63; G. Lemaitre and M. S. Vellarta, “On Compton’s Latitude Effect of Cosmic Radiation,” Physical Review 43 (Jan. 1933): 87-91; G. Lemaitre, M. S. Vellarta, and L. Bouckert. “On the North-South Asymmetry of Cosmic Radiation,” Physical Review 47 (Mar. 1935): 434-36; G. Lemaitre and M. S. Vellarta, “On the Geornagnetic Analysis of Cosmic Radiation,” Physical Review 49 (May 1936): 719-26; R. A. Alpher, “Theoretical Geomagnetic Effects in Cosmic Radiation.” Journal of Geophysical Research 55 /th> (Dec. 1950): 437-71.X
- S. F. Singer, “A New Model of Magnetic Storms,” Transactions of the American Geophysical Union 38 (1957): 175.X
- Significant Achievements in Particles and Fields , 1958-1964, NASA SP-97 (Washington, 1966).X
- Ibid.; John Naugle, Unmanned Space Flight (New York: Holt, Rinehart and Winston. 1965).X
- E. N. Parker, “Dynamics of the Interplanetary Gas and Magnetic Fields,” Astrophysical Journal 132 (1960): 821-66; idem, “The Hydrodynamic Theory of Solar Corpuscular Radiation and Stellar Winds,” Astrophysical Journal 132 (1960): 821-66.X
- K. I. Gringauz et al., “A Study of the Interplanetary Ionized Gas, High-Energy Electrons, and Corpuscular Radiation from the Sun by Means of the Three-Electrode Trap for Charged Particles on the Second Cosmic Rocket,” Doklady Akad. Nauk SSSR 131 (1960):1301; Soviet Phys.-Doklady 5 (1960): 361-64.X
- A. Bonetti, H. S. Bridge, et al., “Explorer 10 Plasma Measurements,” Journal of Geophysical Research 68 (1963): 4017-63.X
- M. Neugebduer and C. W. Snyder, “Solar Plasma Experiment: Preliminary Mariner II Observations,” Science 138 (1962): 1095-97; Snyder and Neugebauer, “Interplanetary Solar Wind Measurements by Mariner II,” in Space Research IV, ed. P. Muller (Amsterdam: North-Holland Publishing Co., 1964). pp. 89-113; Snyder, Neugebauer. and U. R. Rao, “The Solar Wind Velocity and Correlation with Cosmic Ray Variations and with Solar and Geomagnetic Activity,” Journal of Geophysical Research 68 (1963): 6361-70: H. Bridge et al., “Preliminary Results of Plasma Measurements on IMP-A,” in Space Research V , ed. D. G. King-Hele et al. (Amsterdam: North-Holland Publishing Co., 1965). pp. 969-78; “Initial Results from the First Interplanetary Monitoring Platform (IMP I),” I. G. Bulletin 84, in Transactions of the American Geophysical Union 45 (1964): 501.X
- S. C. Freden and R. S. White, “Protons in the Earth’s Magnetic Field.” Physical Review Letters 3 (1959):9.X
- NASA, Particles and Fields , 1958-1964, pp, 17-19.X
- Ibid., pp. 19-29.X
- N. F. Ness, C. S. Scearce, and J. B. Seek, “Initial Results of the IMP I Magnetic Field Experiment.” Journal of Geophysical Research 69 /th> (1964): 3531 -69.X
- Bridge et al., “Preliminary Results of Plasma Measurements on IMP-A”; “Initial Results from the First Interplanetary Monitoring Platform (IMP I),” I.G. Bulletin 84.X
- N. F. Ness, “The Magnetohydrodynamic Wake of the Moon,” Journal of Geophysical Research 70 (1965): 517-34.X
- NASA, Particles and Fields , 1958-1964, p. 55.X
- Ibid., pp. 52-53.X
- B. J. O’Brien, “Lifetimes of Outer Zone Electrons and Their Precipitation into the Atmosphere,” Journal of Geophysical Research 67 (1962): 3687.X
- NASA, Particles and Fields, 1958-1964, pp. 33-34.X
- Singer, “A New Model of Magnetic Storms.”X
- Norman F. Ness to Homer Newell, 12 July 1978, comments on draft Newell MS., NF40.X
- Norman F. Ness et al., “Early Results from the Magnetic Field Experiment on Lunar Explorer 35,” Journal of Geophysical Research 72 (Dec. 1967): 5769.X
- W. A. Heikinen, “Geodesy,” Encyclopaedia Britannica , 1967 ed, vol. 10, p. 134. Much of the historical summary of the next few paragraphs is based on Heiskanen’s article.X
- Ibid., p. 34.X
- Myron Lecar, John Sorenson, and Ann Eckels, “A Determination of the Coefficient J of the Second Harmonic in the Earth’s Gravitational Potential from the Orbit of Satellite 1958 ß2,” ibid., pp. 181-97.X
- E. Buchar, “Determination of the Flattening of the Earth by Means of the Displacement of the Node of the Second Soviet Satellite (1957 ß),” Annals of the IGY , 12, pt. 1 (1960): 174-76; Harvard College Observatory Announcement Card 1408, “Oblateness of the Earth by Artificial Satellites, “ibid., 176.X
- S. W. Henriksen, “The Hydrostatic Flattening of the Earth,” ibid., pp. 197-98.X
- W. M. Kaula, “The Shape of the Earth,” in Introduction to Space Science , ed. Wilmot N. Hess and Gilbert D. Mead (New York: Gordon and Breach, 2d ed., 1968), p. 333.X
- J. A. O’Keefe, Ann Eckels, and R. K. Squires, “Pear-Shaped Component of the Geoid from the Motion of Vanguard I,” Annals of IGY , 12, pt. 1 (1960):199-201; Desmond King-Hele, “The Shape of the Earth,” Science 192 (25 June 1976): 1293-1300.X
- W. M. Kaula, “Current Knowledge of the Earth’s Gravitational Field from Optical Observations,” in Significant Achievements in Satellite Geodesy , 1958-1964, NASA SP-94 (Washington, 1966). p. 33.X
- C. A. Wagner, “A Determination of Earth Equatorial Ellipticity from Seven Months of Syncom 2 Longitude Drift,” in Satellite Geodesy , 1958-1964, pp. 93-97.X
- H. M. Dufour, “Geodetic Junction of France and North Africa by Synchronized Photographs Taken from Echo I Satellite,” ibid., pp. 109-20.X
- Robert R. Newton, “Geometrical Geodesy by Use of Doppler Data,” ibid., pp. 121-23.X
- Owen W. Williams, Paul H. Dishong, and George Hadgigeorge, “Results from Satellite (ANNA) Geodesy Experiments,” ibid., pp. 129-38.X
- Satellite Geodesy , 1958-1964, p. 155; Wagner, “Earth Equatorial Ellipticity,” ibid., p. 96.X
- "Report of the Working Group on the System of Astronomical Constants: Agenda and Draft Reports,” International Astronomical Union, 12th General Assembly, 25 Aug.-3 Sept. 1964. reprinted in Satellite Geodesy , 1958-1964, pp. 101-06.X
- John O’Keefe to Homer Newell, 22 June 1978, comments on draft Newell MS., NF40; W. A. Heiskanen and F. A. Vening Meinesz, The Earth and Its Gravity Field (New York: McGraw-Hill Book Co., 1958), p. 72.X